Scan
Spotter allows you to check the quality of your private Ansible content, such as tasks, playbooks, roles, and collections to improve its quality, and enables you to check the quality of public Git repositories to ensure that the resources you’re using are dependable, secure and well-maintained.
Scan your Ansible Content
If you want to scan private Ansible content, you can do so via Spotter CLI. All you have to do is run spotter scan command, sit back and get your scan results. See
DEMO
or
read tutorial
.
spotter scan path/to/playbook.yml
Copied!
Note
When you use the spotter scan command, it carries out a basic scan that doesn’t cover all the upgrade or security checks by default. If you want to include those checks, you need to define an appropriate profile . Learn more about scanning profiles.
With Spotter, you can scan a single .yml file, multiple .yml files, or an entire folder. Learn more in Spotter Docs.
Analyze scan results
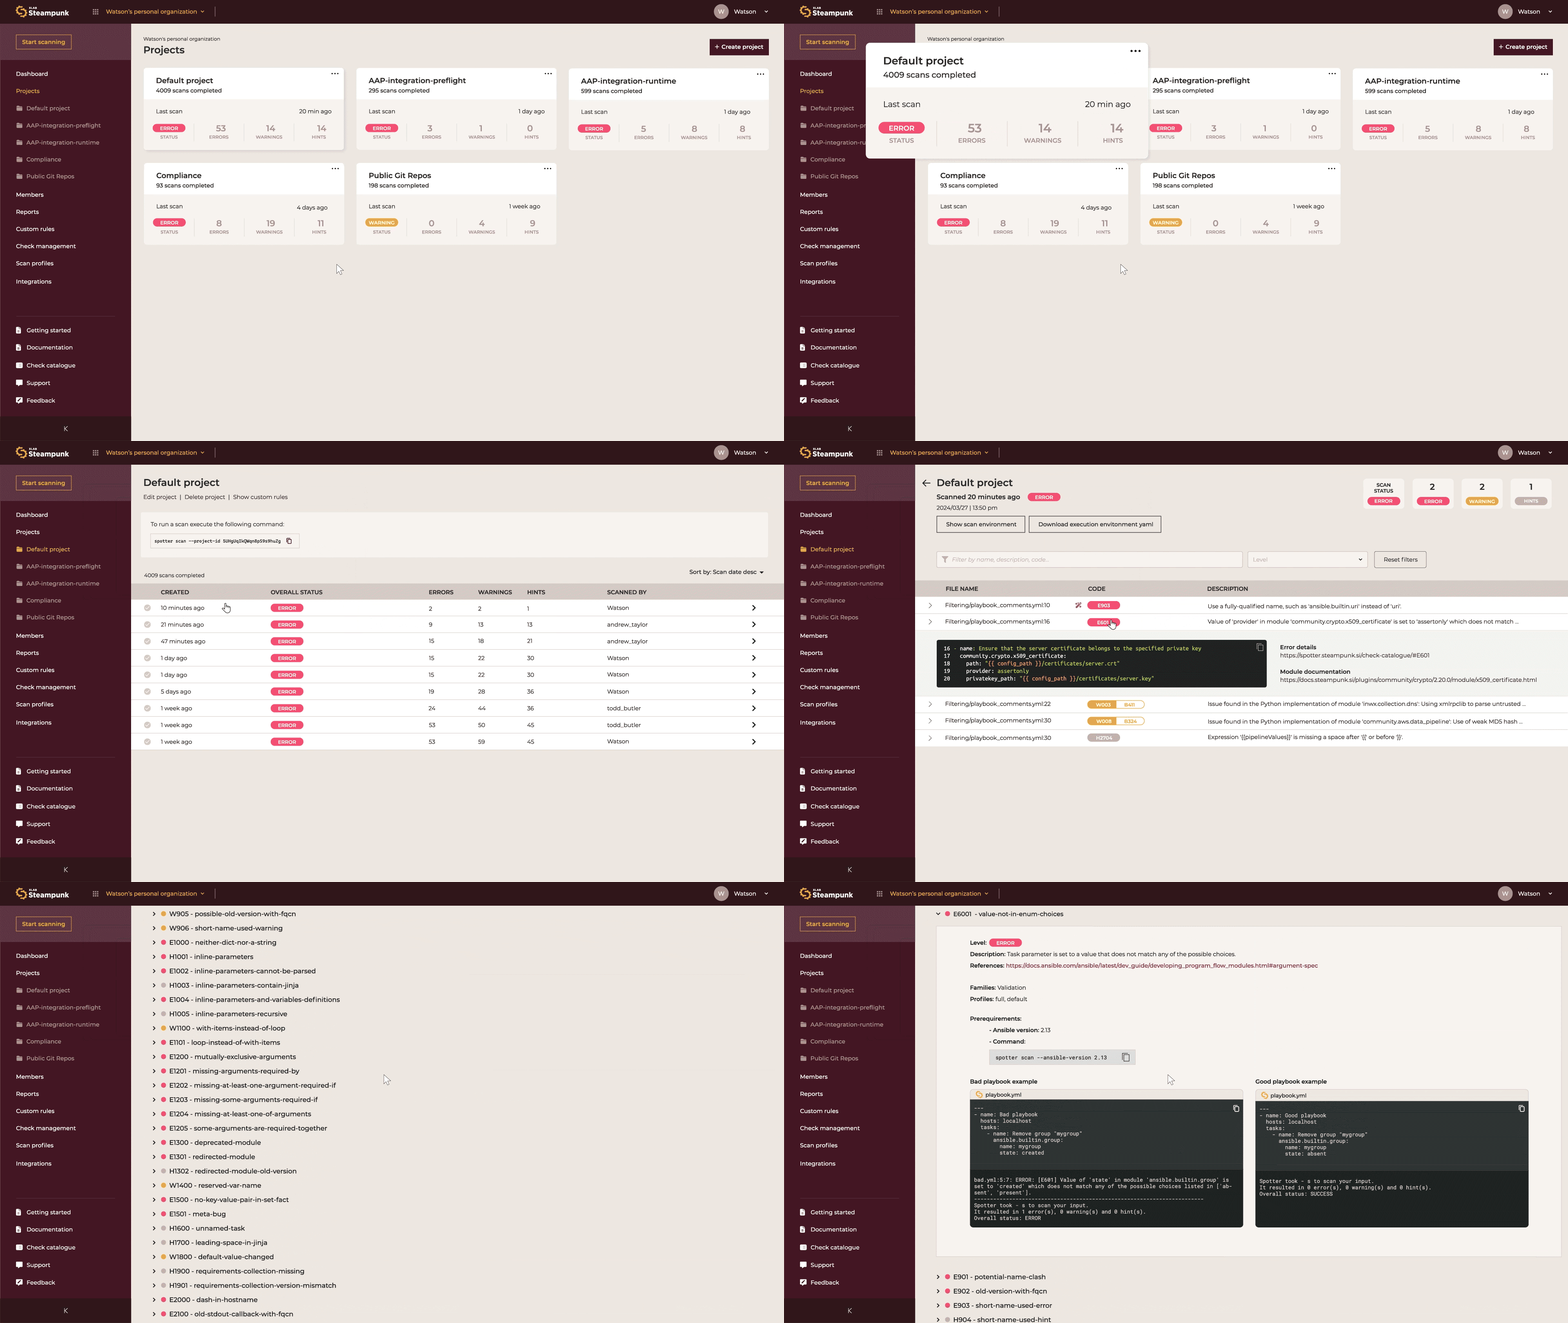
You can also view more detailed scan results in the Spotter App. Simply click the provided link or open the app and navigate to Projects. Here, you’ll find all errors, warnings, and hints, complete with actual code snippets that you can share with your team for easier troubleshooting.
Click on the link below Details or numerical code icon will take you into the check catalogue to help you explore your error, hint, or warning in more detail, with helpful good and bad examples of playbooks.


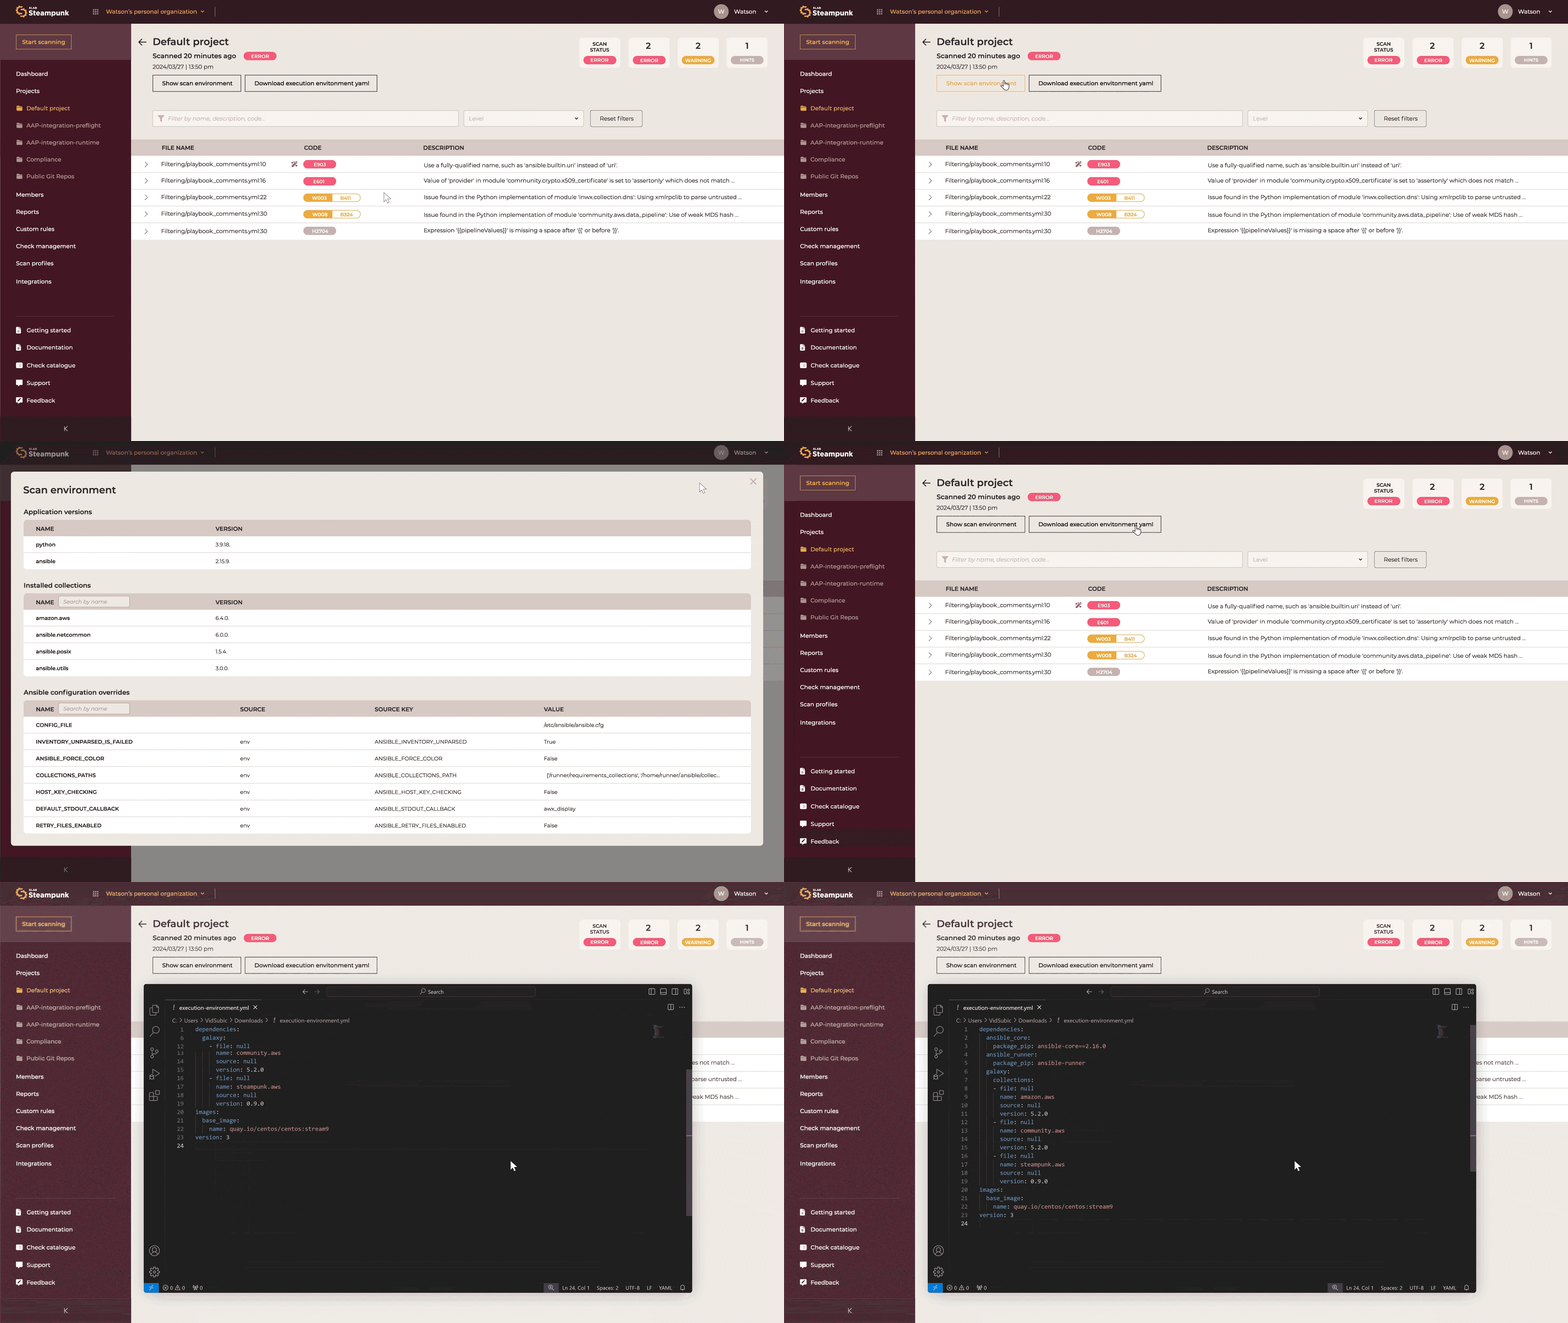
You can also inspect the scan environment to see Ansible and Python versions, installed collections, and Ansible configuration overrides, which helps you replicate the same conditions in the future or share them with others, and even download the pre-generated execution environment YAML files to save time and effort.


Check the Quality of Public Git Repositories
To assess the quality of public Git repositories, head over to the
Spotter app
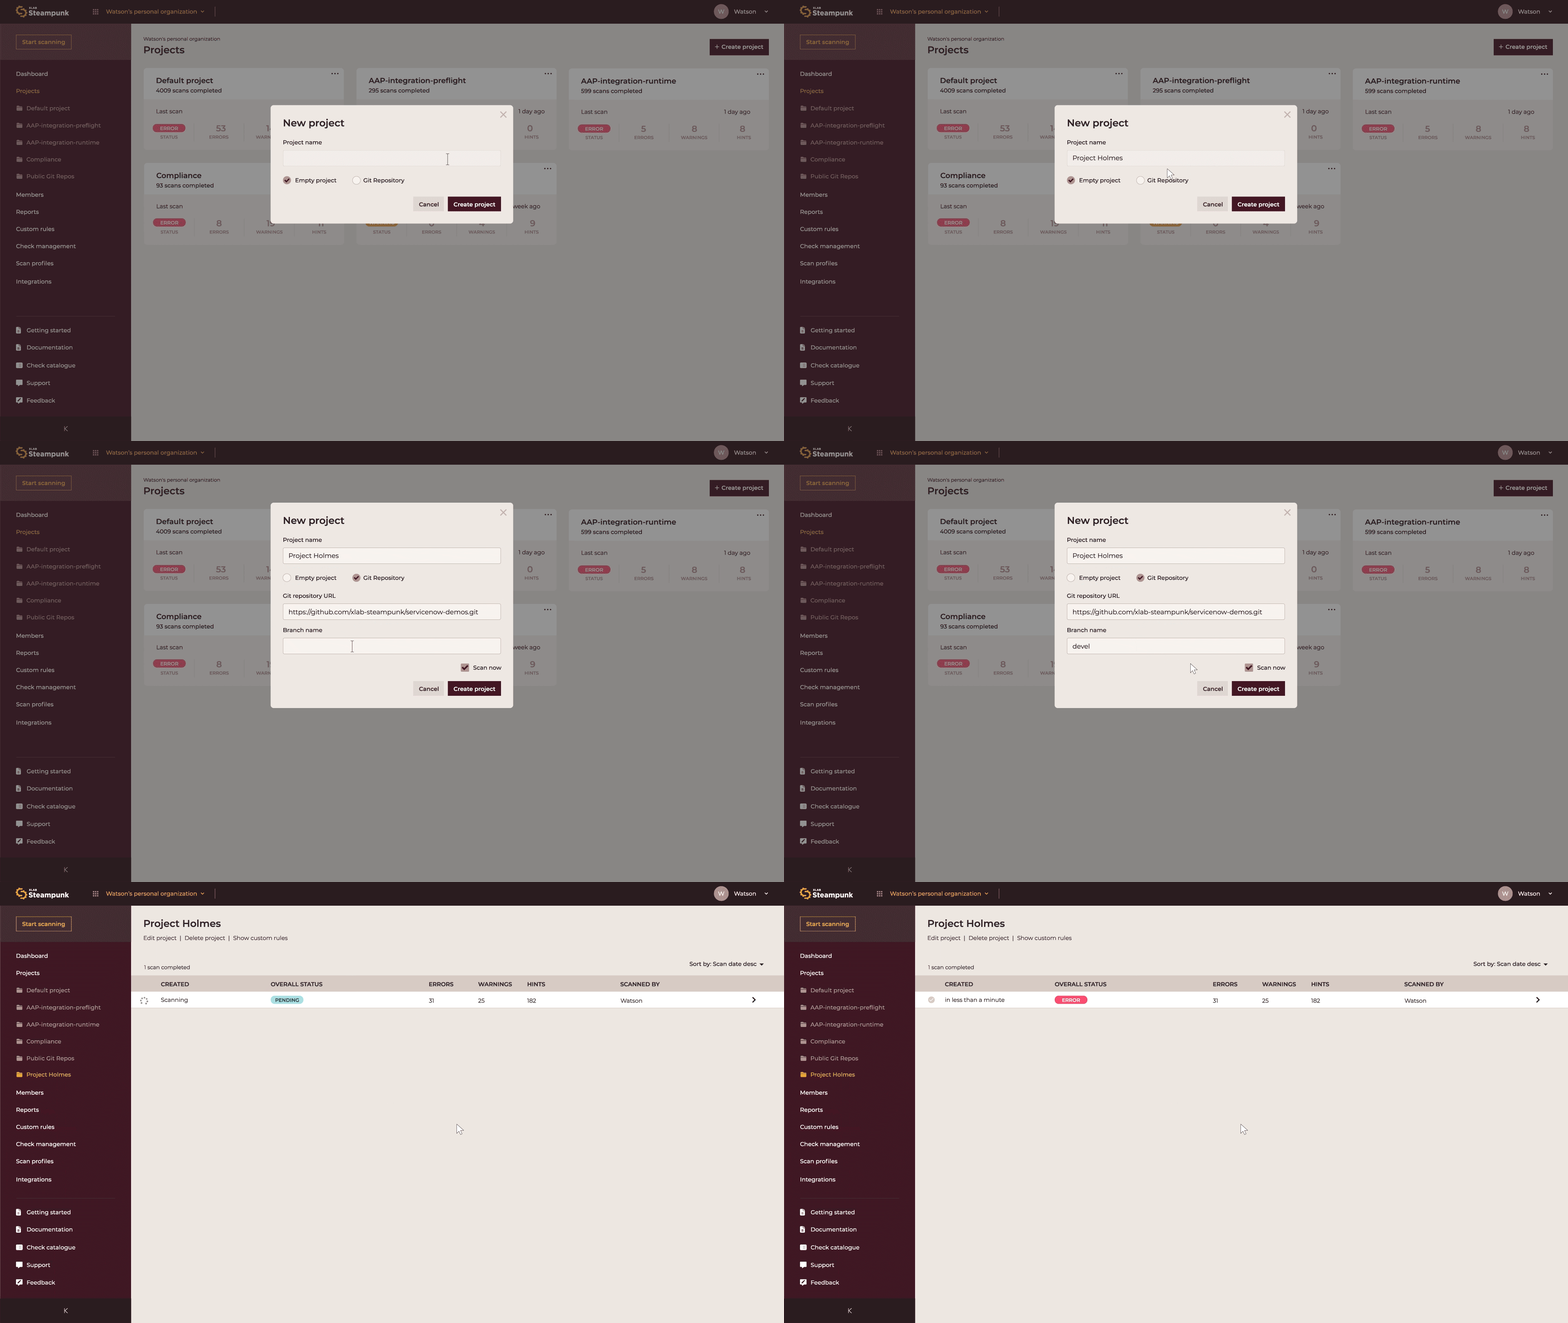
and click New project. Check the ‘Git repo box’, paste the URL into the form and click Run scan.


You can see the results of your scan by clicking Scan results on the right side of the screen, and rerun the scan of the same Git repository anytime by clicking Rerun button to monitor progress.
Select the Target Project
Spotter offers insights into all your scans, which you can view in the
Spotter app
. By default, your scan results are stored in the first project of your first organization, but if you want to organize your scans or have multiple organizations or projects to bring some order to your automation workflows, then “Projects” is your go-to feature.


To specify the project under which you wish to see specific scan results, use --project-id optional argument. Use it to specify the ID of an existing target project, where the scan result will be stored.
spotter scan --project-id <project-id>
Copied!Where can you find the project ID? Go to
Spotter app
, select the appropriate organization and designated project and copy it.


You can always create new projects by clicking “Create new project. “


Configure Your Scans
You can choose how the scanning works by using a setup file or special commands you type into the command line. Spotter offers different ways to adjust the scan settings, and each time you make a change, it replaces the old settings. Spotter also supports files that use JSON or YAML formats to save your configurations.
Local Discovery
Spotter client detects your workstation environment by internally running ansible --version.
To manually override the detected version of Ansible, use the --ansible-version <ansible_version> switch:
spotter scan --ansible-version 2.9
Copied!Configuration File
Customize your experience with Spotter using a project-level configuration file called .spotter.json, .spotter.yml, or .spotter.yml.
Provide your configuration file with the
–configargument.
spotter --config config.yml scan playbook.yml
Copied!Optional CLI Arguments
For example: --ansible-version , --profile, --display-level, etc.
In your configuration file you can set:
Ansible version
Skipping or enforcing checks
An example of a YAML configuration file:
ansible_version: “2.9”
skip_checks: [ “E1300”, “E1301”, “H1302”]
enforce_checks: [ “E005”, “W200”, “H500”]
And if you are using the JSON configuration file format, use:
"ansible_version" : "2.14"
}
Determine the Amount of Data You Share with Spotter
We know data protection and security are not to be taken lightly. That’s why you are in charge of how much data you share with Spotter. To get the most in-depth and valuable scan reports, Spotter collects values and metadata when checking the quality of your playbooks. Don’t worry, all secrets are automatically detected and replaced with null values to increase security.
If you are still concerned about data sharing, you can always choose to exclude such data from your scan. Just keep in mind the scan performed won’t be as insightful in this case, but rest assured, it will still be efficient. You can extract the data locally before submitting it, which allows you to review the data, edit it, and then push it for scanning.
So, if you want to exclude additional data, you can do so like this:
Exclude Values
To exlude collecting data such as task names, parameter values, and filenames that enable more valuable scan reports and additional tips for improvements, and use only module names and the names of parameters used in your playbooks, run:
spotter scan --exclude-values playbook.yml
Copied!Exclude Metadata
You can also opt-out of uploading metadata, such as file names, line numbers, and column numbers. Just run:
spotter scan --exclude-metadata playbook.yml
Copied!See Collected Data
If you want to check the information gathered from your Ansible content without actually running a scan, you can use the --export-payload option. Exporting the scan payload lets you see how the scanning process works, so you can look over and understand the data collected before you start the real scan.
spotter scan --export-payload payload.json playbook.yml
Copied!After that, you can also import the exported payload with --import-payload argument and scan it:
spotter scan --import-payload payload.json
Copied!Or simply choose the on-prem deployment option . and avoid any data-sharing concerns you might have.
Customize Outputs
Everyone has their own way of doing things. We’ve got you. Spotter is all about flexibility. Whether you’re a “get to the point” person or someone who loves diving deep, Spotter lets you customize your automation to match your style.
Display Only Specific Types of Warnings
Spotter thoroughly analyses your playbooks and offers three levels of warnings, depending on the severity of found issues: errors, warnings and hints.
ERROR Ansible Playbook execution will likely fail.
WARNING Ansible Playbook may do something unexpected.
HINT Ansible Playbook is not fully encapsulating Ansible best practice.
If you’d rather do your own thing and just look for the errors that will wreak havoc and are absolutely necessary to resolve, you can tell Spotter to show you only ERRORS by simply using the --display-level optional argument.
spotter scan --display-level error playbook.yml
Copied!You can also run only warnings or only hints the same way, but we would strongly advise against it, even if you’re feeling reeeealy adventurous.
To show only HINTS
spotter scan --display-level hint playbook.yml
Copied!To show only WARNINGS
spotter scan --display-level warning playbook.yml
Copied!Change Scan Result Type
By default, Spotter CLI provides clear and concise plain text results, keeping things simple and straightforward. However, we understand that some users crave more flexibility and versatility. You can choose to see scan results in different formats, just specify the desired format such as JSON or YAML in the optional argument.
spotter scan --format json playbook.yaml
Copied!Omit Documentation URLs
Spotter offers convenient time-saving feature of offering direct links to module documentation (URL to the relevant Ansible content documentation whenever possible) that saves you a lot of time you would otherwise spend browsing for it online. But we know that sometimes you just want the raw results without any fuss. With --no-docs-url argument, you can skip the documentation and focus solely on the check results.
spotter scan --no-docs-url playbook.yml
Copied!Disable Colorized Output
Spotter shows errors, hints and warnings in different colors to make the types and severity of found issues visible at a quick glance. But if you’re more of a black or white person or your life is already colorful enough or you simply prefer a more classic approach, just use the --no-color option to go colorless:
spotter --no-color scan playbook.yml
Copied!Set Storage Folder
By default, your home for your tokens is at ~/.config/steampunk-spotter . But if you want to change it, you can use the --storage-path optional argument which allows you to customize your storage destination.
spotter --storage-path /my/project/.storage scan playbook.yml
Copied!Set API Endpoint
Spotter CLI is your gateway to a world of possibilities, and we’ve made it incredibly easy to tailor your API endpoint just the way you like it.
There are multiple ways to set your API endpoint:
- The
--endpointglobal optional argument: A simple command to specify the API endpoint directly.
spotter --endpoint "<spotter-api-url>" scan playbook.yml
Copied!- The SPOTTER_ENDPOINT environment variable: Exporting the SPOTTER_ENDPOINT environment variable with your chosen API endpoint.
export SPOTTER_ENDPOINT=<spotter-api-url>
Copied!- Create a configuration file in the storage folder (located at
~/.config/steampunk-spotter/spotter.json) with the root JSON entry"endpoint": "<endpoint>", and your chosen API endpoint will remain constant. You can create it manually with the following JSON content:
{
“ansible_version” : "<ansible-version>"
}
- And, if you prefer the default, fear not. Our Spotter SaaS API endpoint will always be there to support you, welcoming you with open arms at: https://api.spotter.steampunk.si/api .


