Steampunk Spotter Guide
Analytics and Reporting
No matter where you perform your scans, you can see the scan history and analytics in the Spotter app, enabling you to track the frequency of failed playbook executions, identify common errors, spot trends, and monitor progress. You do not have to spend hours searching for the source of the problem. Addressing playbook pain points and finding potential solutions has never been faster, easier, and most importantly – more transparent. Watch DEMO or read blog .
You don’t have to do anything, scans are automatically imported in the app and automatically stored in the first project of your first organization. But if that’s not where you want them to be stored, you can always choose where the results of a specific scan are stored.


Dashboard
The Dashboard provides a quick overview of key information, allowing you to see the ways your team is using Spotter, the most common challenges they’re conquering and track performance in real time. It allows you to keep up with the number of scans executed in a specific organization, number of errors and executed checks, and overview of the most common errors.

To get detailed analytics, head over to the Reports tab.
Reports
Get a complete overview of your scans and your users.
Reporting feature provides deep insights into specific aspects of your automation, allowing you to plan actions accordingly. Analyse most common errors and identify its causes to determine mitigation strategies and implement strategies for unified and optimized automation.
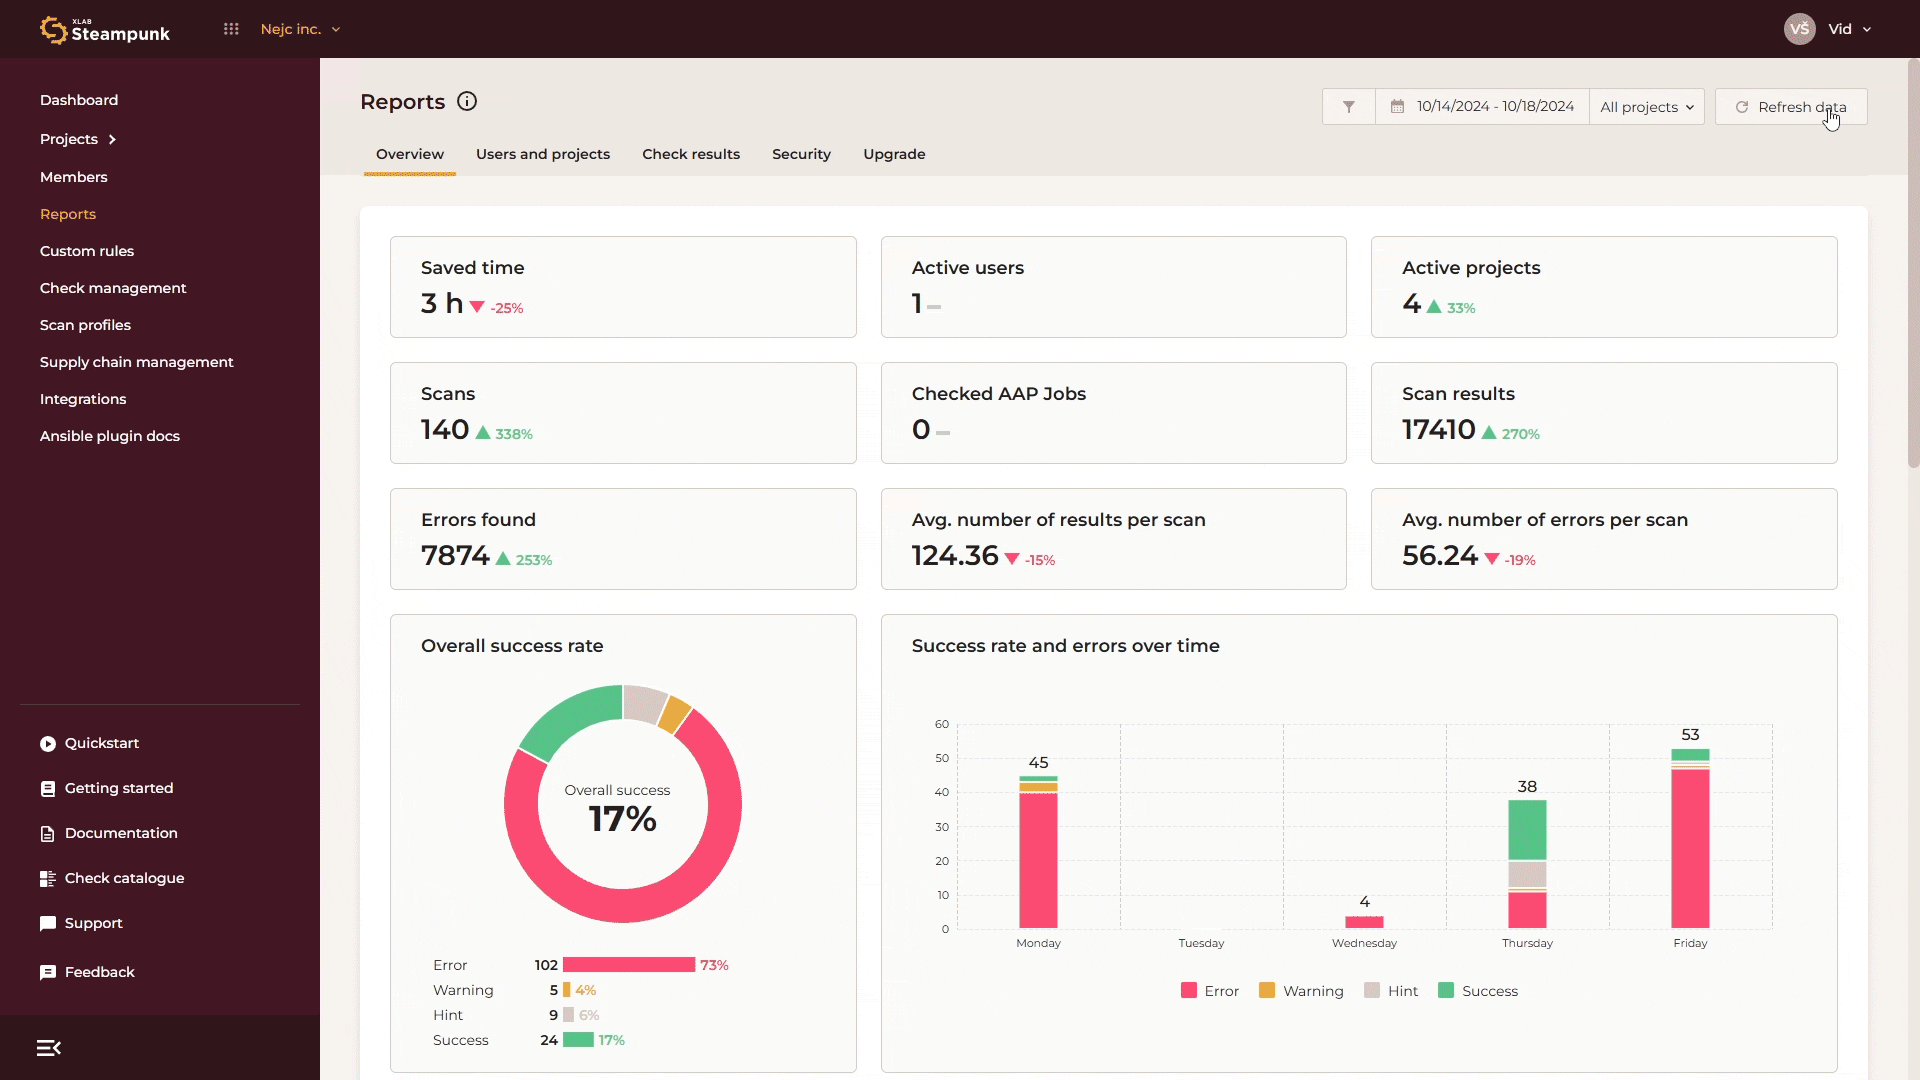
Overview
Access crucial data at a glance to track most important day-to-day metrics. The Overview tab combines essential metrics into a single view.
Get insights on saved time, active users and projects, scans, scan results, checked Red Hat Ansible Automation Platform jobs, errors found, averages, success rates, common mistakes, and modules used in playbooks.
Check Results
Here’s where you’ll find detailed information on all errors, warnings and hints that Spotter has found in your playbooks. You’ll also see which issues Spotter automatically fixed for you, so you can have a better idea of just how much manual work and time it saved you.
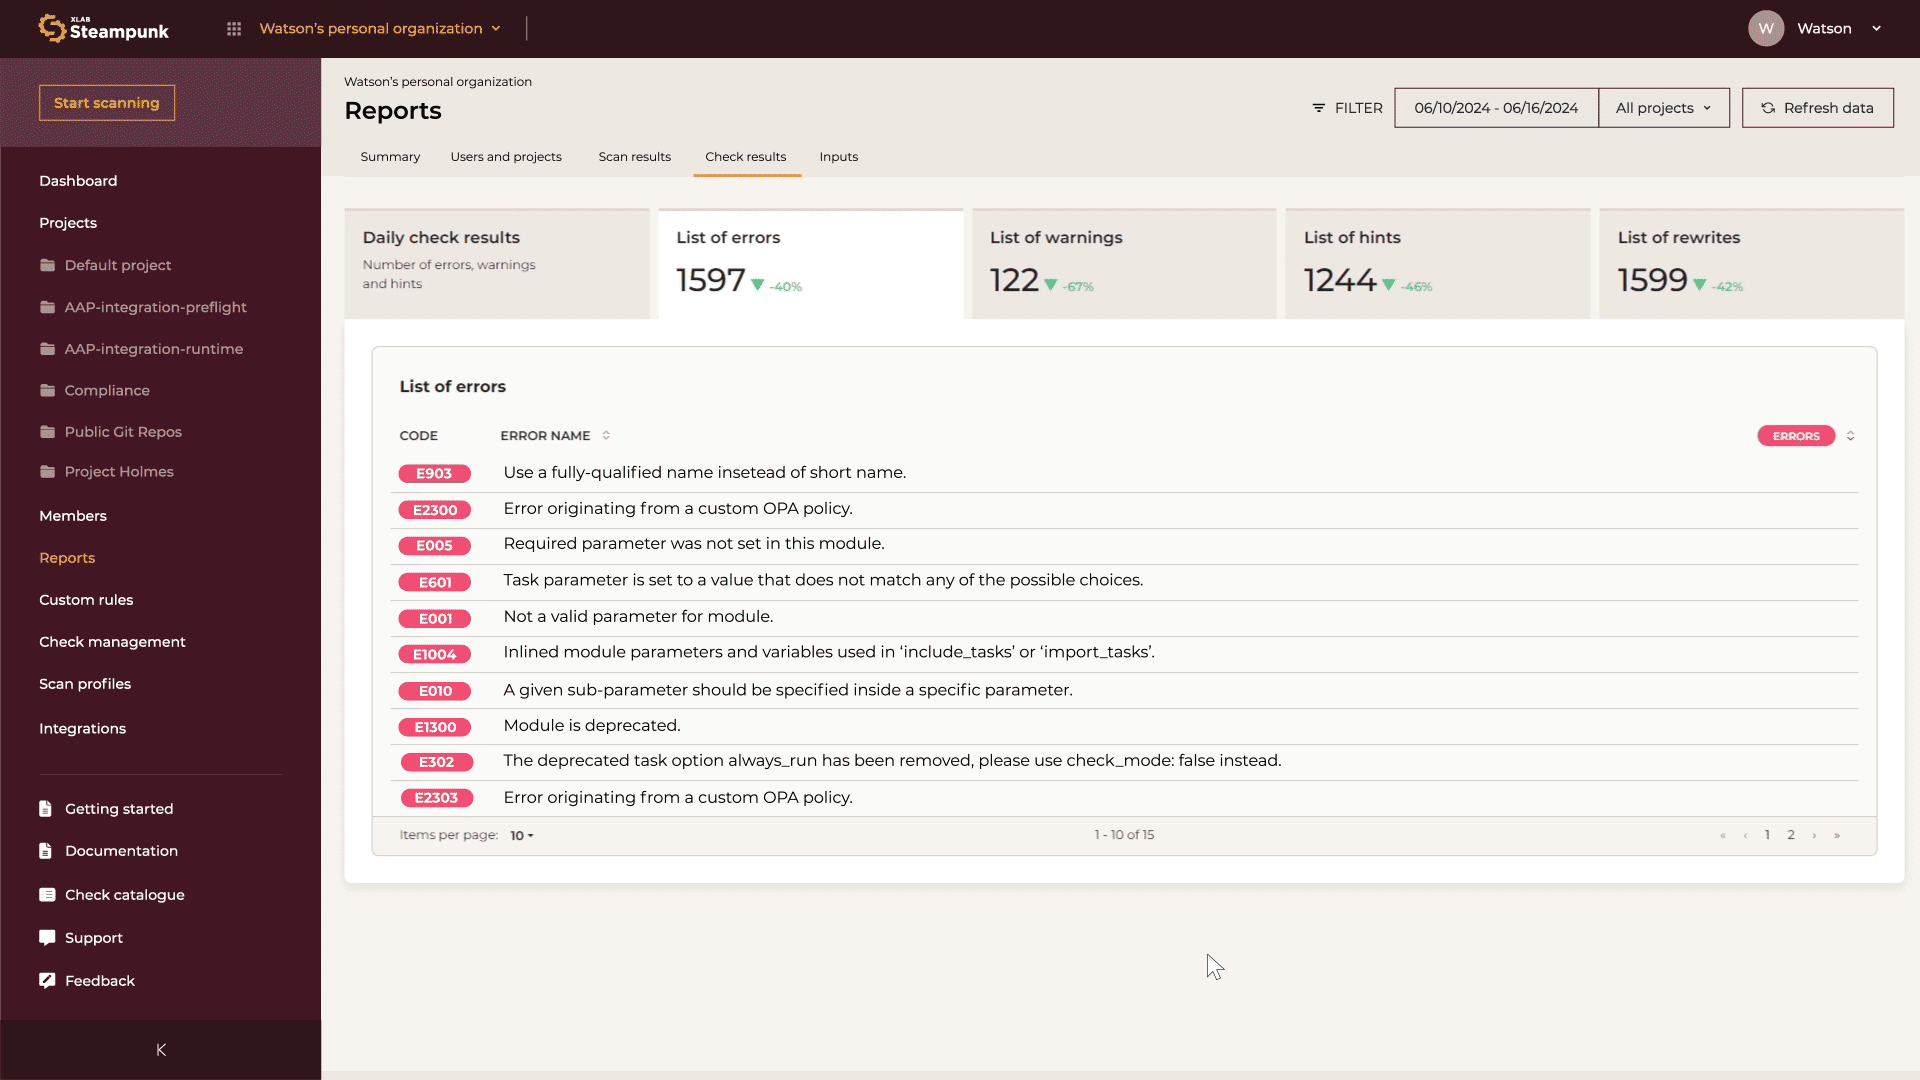
When examining the issues, simply click on the numeric code that takes you into the check catalogue and see your error, hint, or warning in more detail, with helpful good and bad examples of playbooks. Harness these insights to streamline your automation processes, ensuring precision and reliability every step of the way.

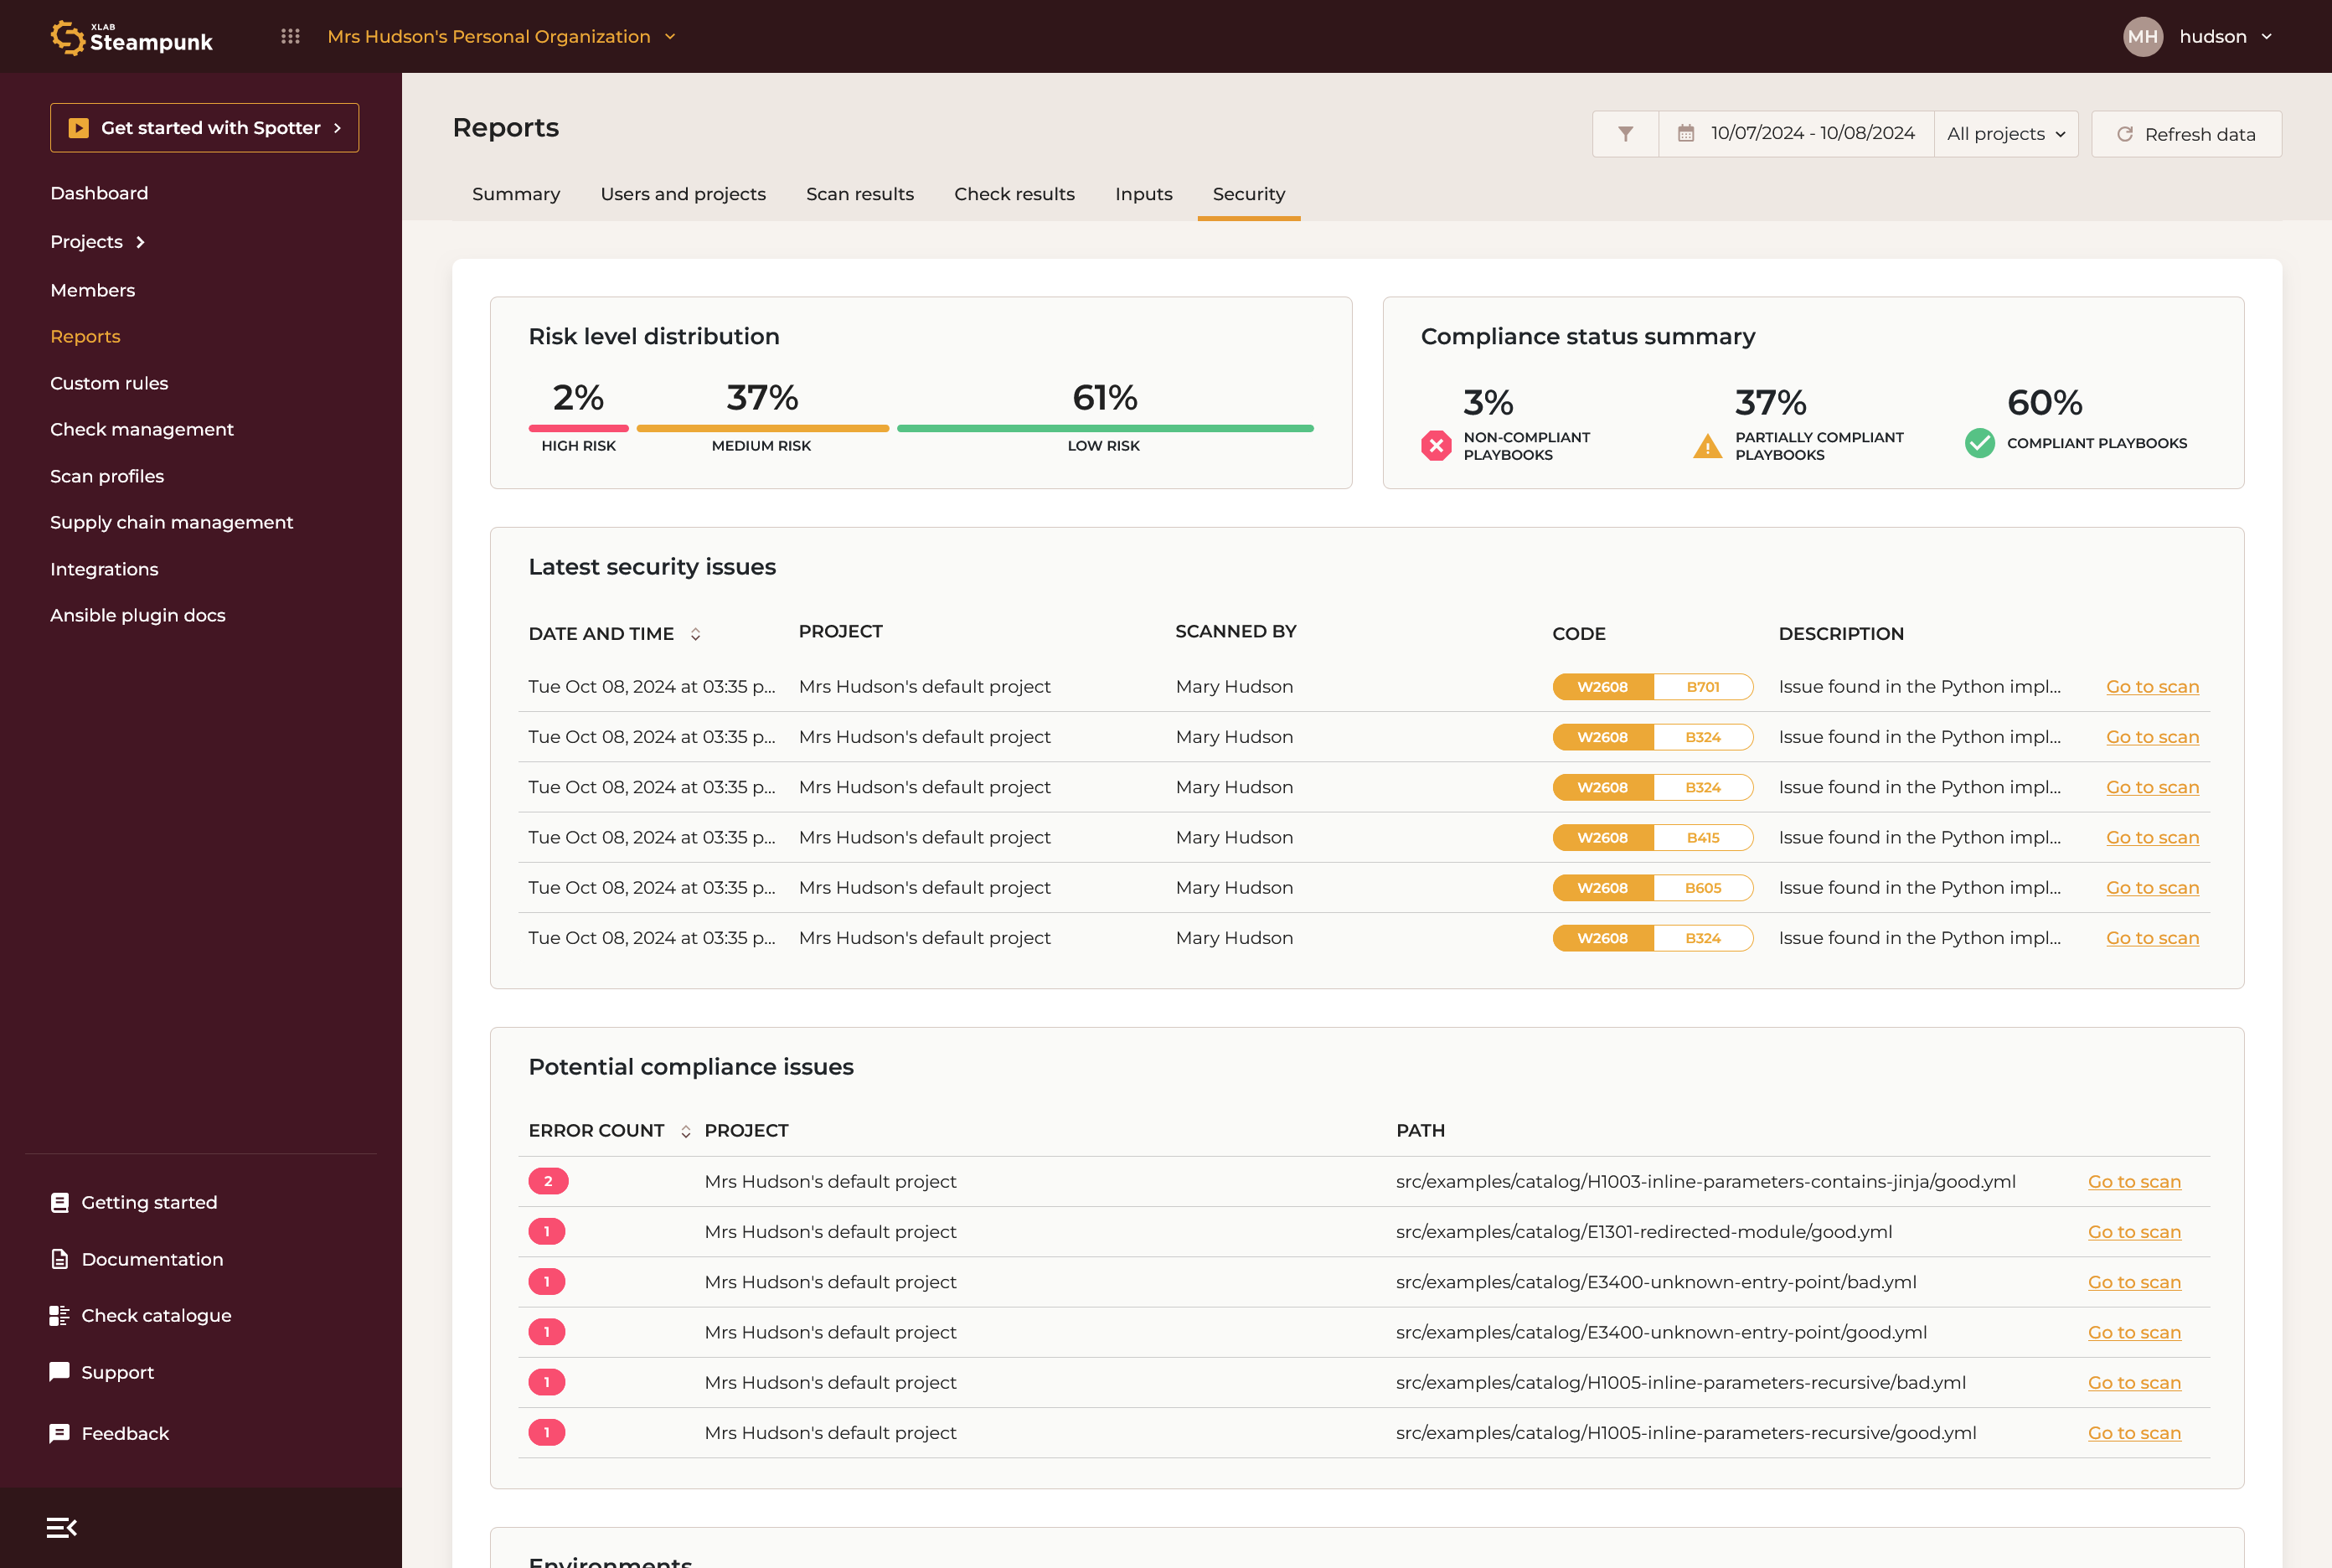
Security
The Security tab helps you keep a closer eye on your Ansible automation projects by offering a deeper insight into projects’ security status. This includes tracking unresolved security-related issues, identifying risk levels, and assessing the scope of any vulnerabilities reported by Spotter.
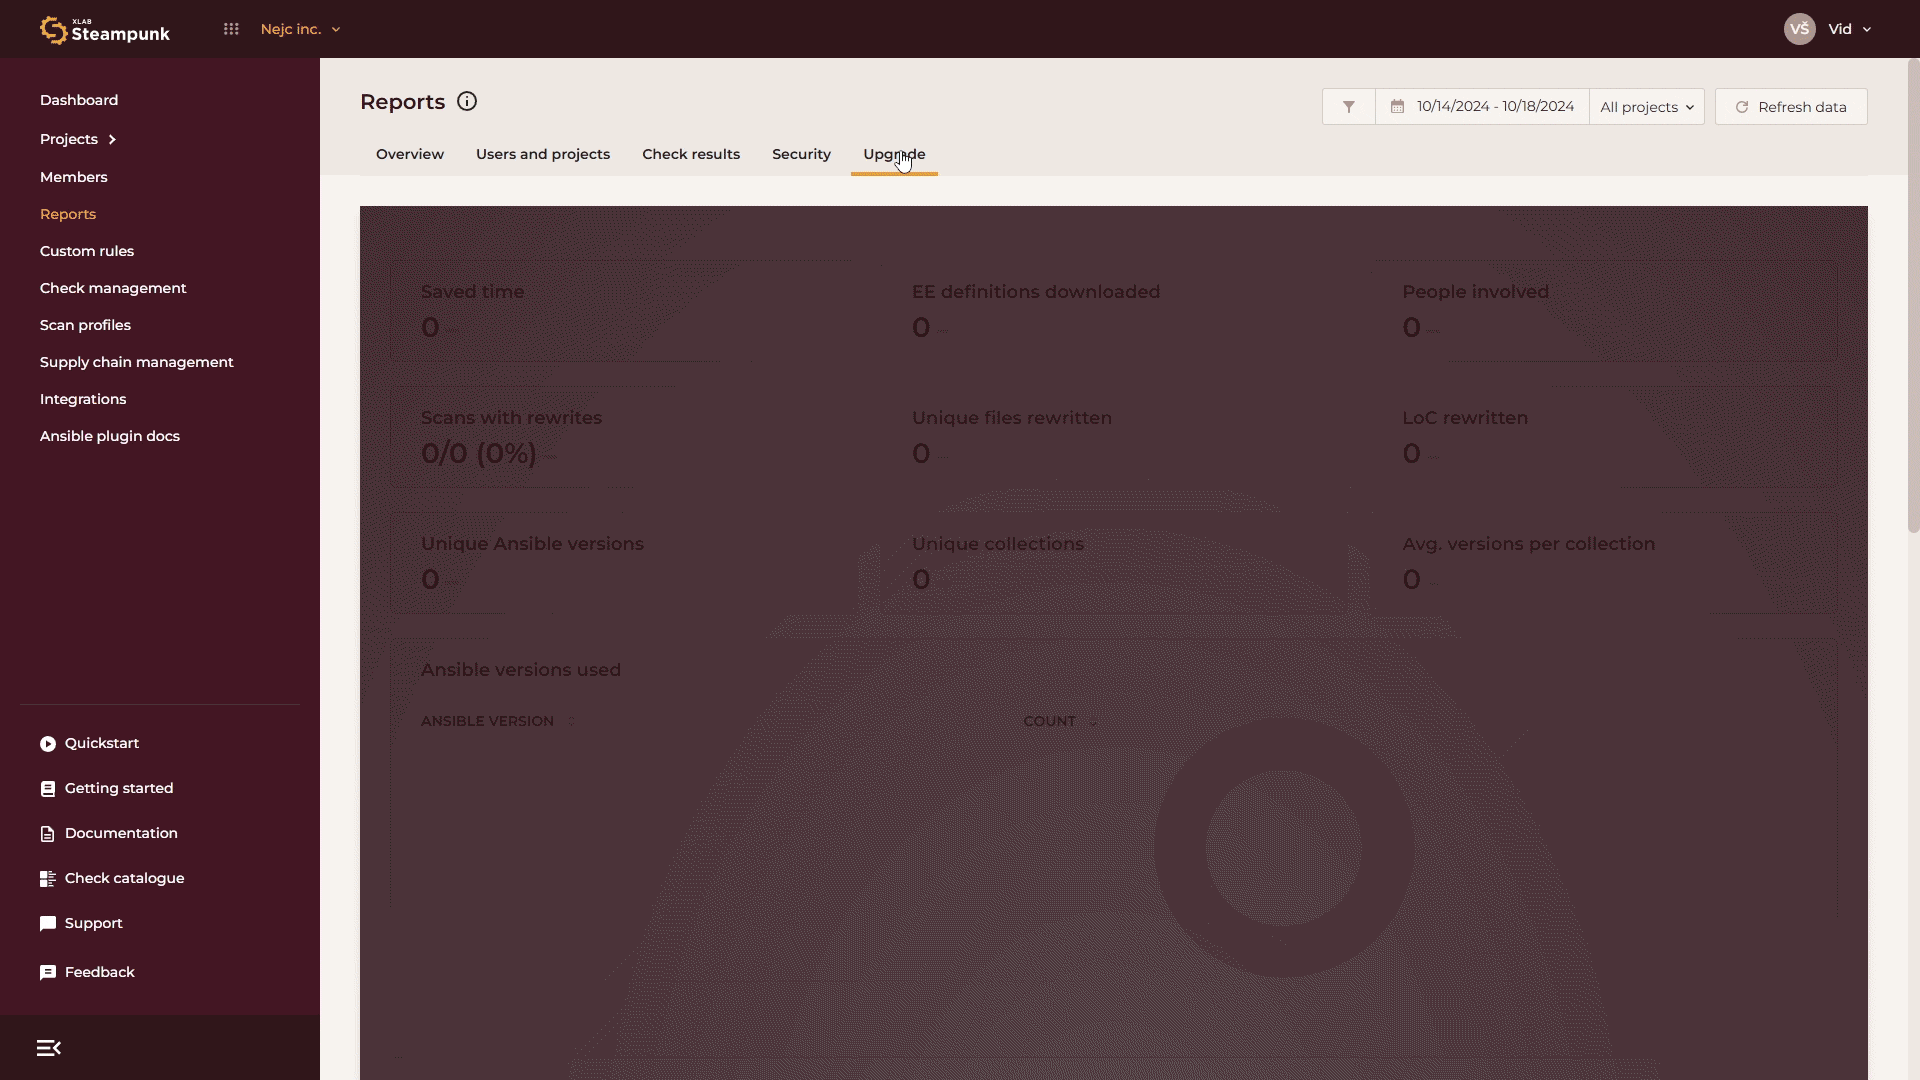
Upgrade
Get insights into upgrading Ansible Playbooks, the Ansible version, collection versions and migrating to a newer version of the Red Hat Ansible Automation Platform. These reports help you monitor your team’s progress as they work through any issues while migrating automation projects to the latest Ansible environments and managing dependency updates. Stay informed about issues that need to be resolved and easily check which ones have recently been fixed.
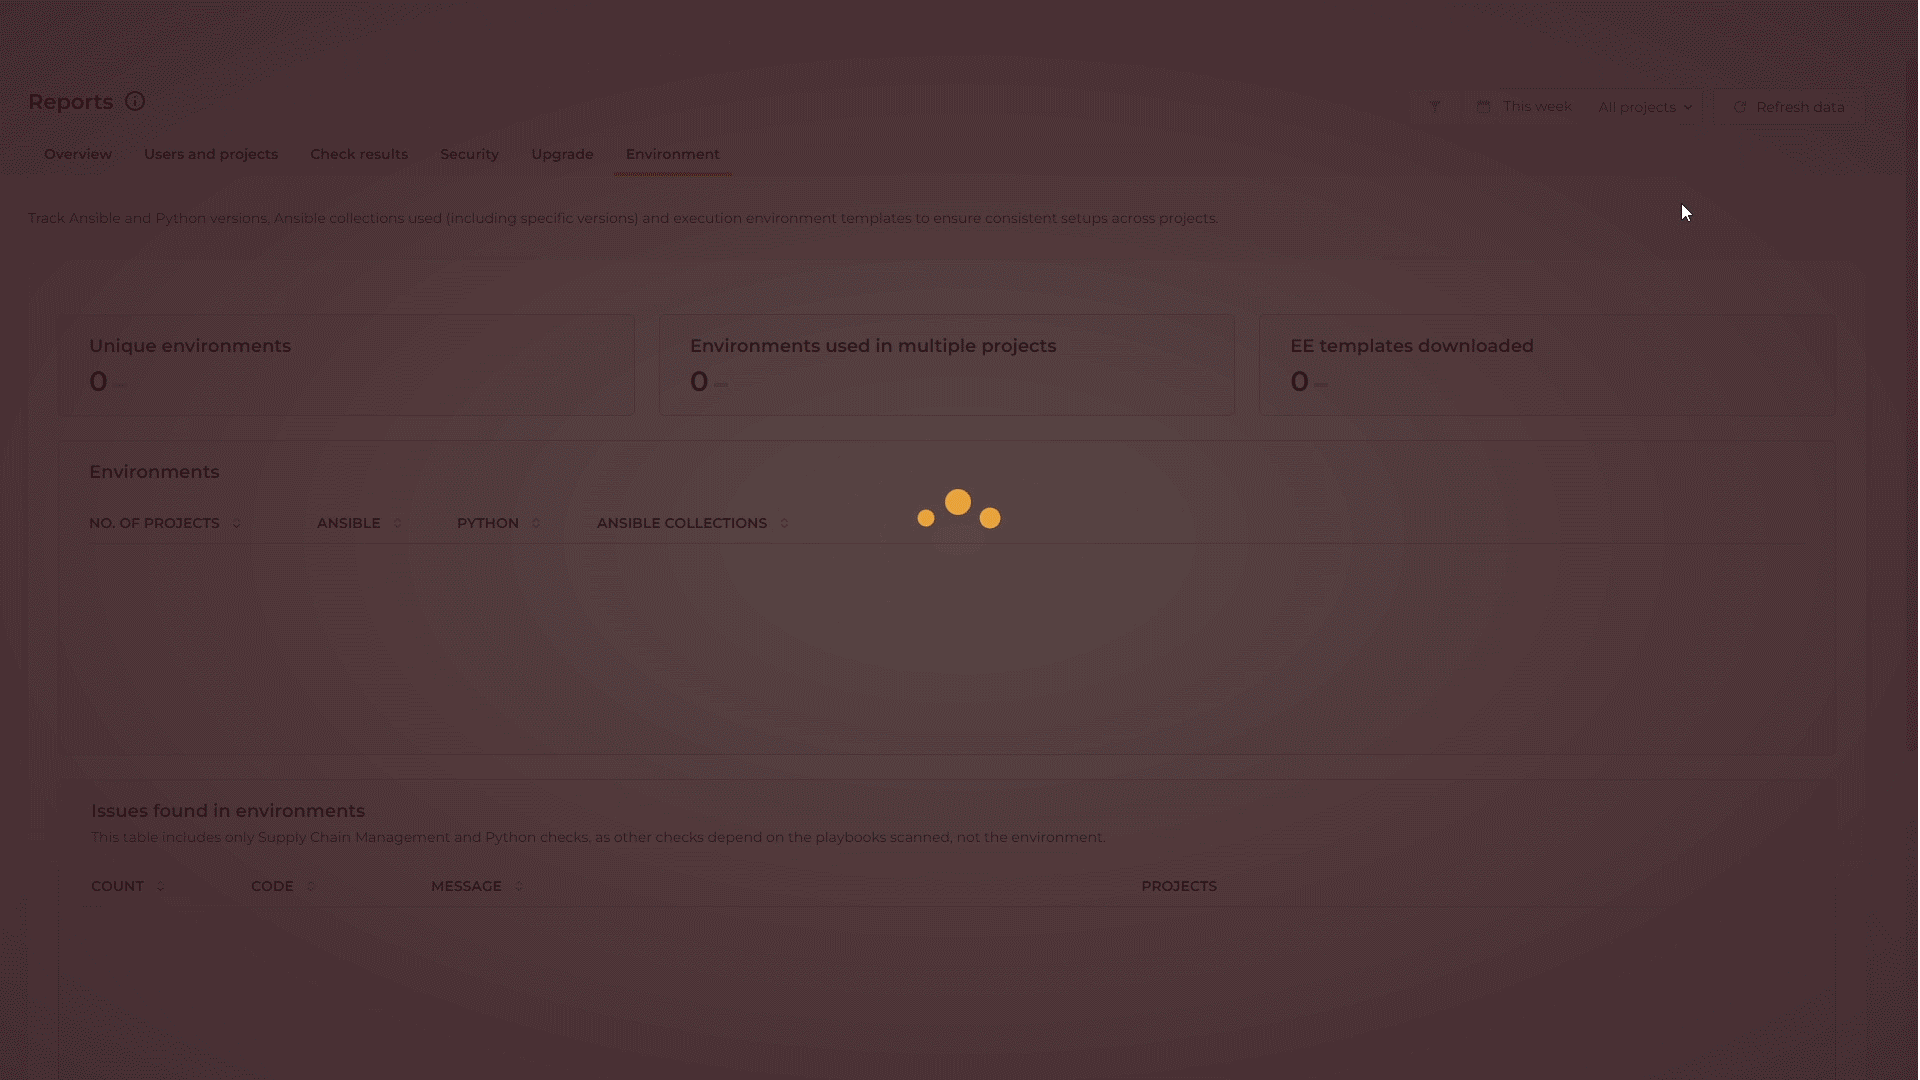
Environment
Get a clear overview of the technical landscape within your projects. Track Ansible, Python and collections versions and execution environments to identify and resolve compatibility issues, ensuring consistent setups across projects.